Release Burndown & Burnup
Release Burndown & Burnup
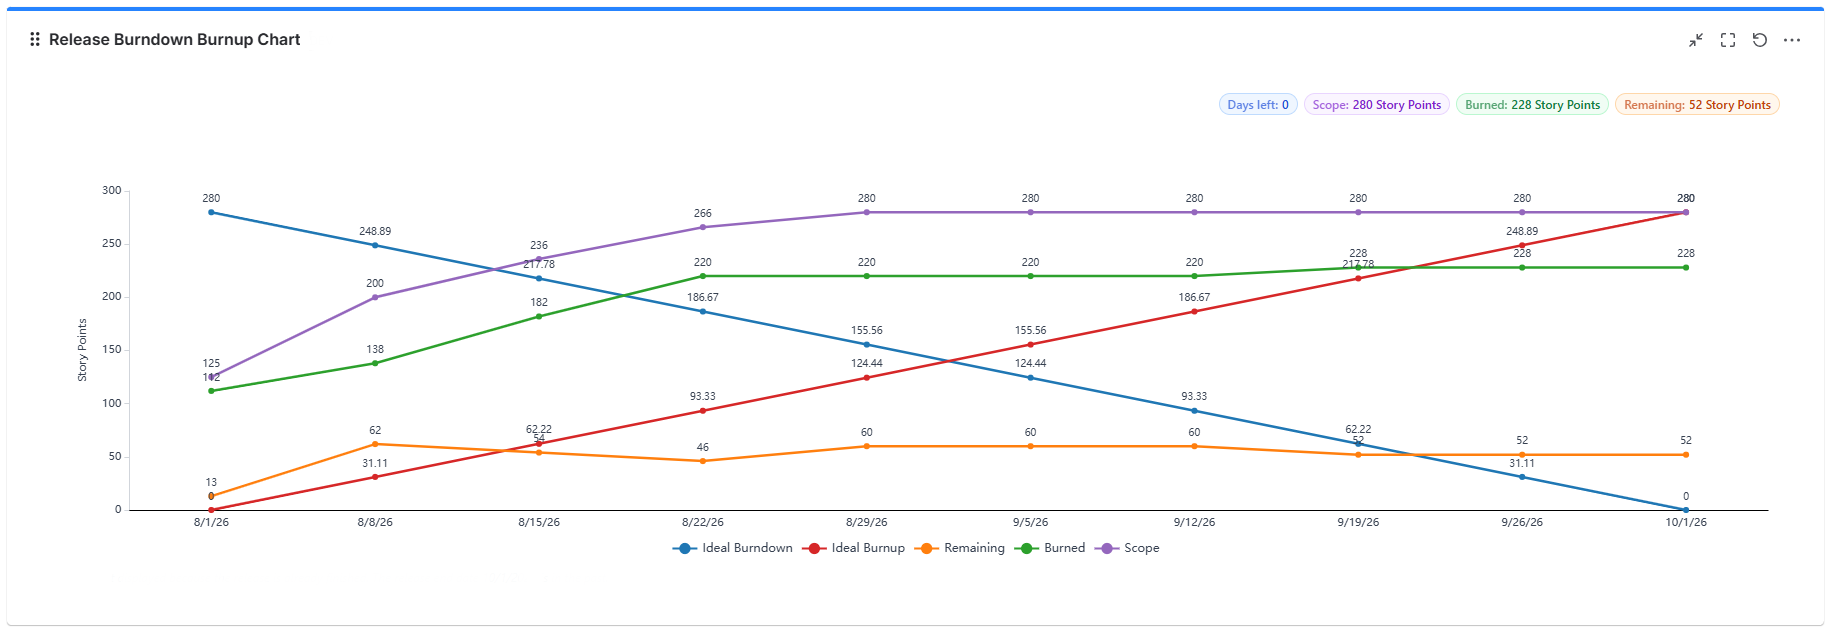
The Release Burndown Burnup Chart gadget tracks a whole release over time - how much work is left, how much is done, and how the scope moved - and forecasts when the remaining work will finish. Where Sprint Burndown & Burnup covers one sprint on one board, this gadget covers any timeframe you choose: custom dates, a project release, or a sprint.
In This Section
| Page Name | Description |
|---|---|
| Overview | What the chart shows, data sources, the Time Range, and the numbers above the chart. |
| Data & Series | Sub-tasks, Fix versions scoping, intervals, what to measure, and which lines to draw. |
| Forecast & Milestones | How the end date and scope are forecast, and how to mark milestones on the chart. |
| Display & Export | What "Done" means, chart display options, colors, auto refresh, and export. |