Control Chart
Control Chart
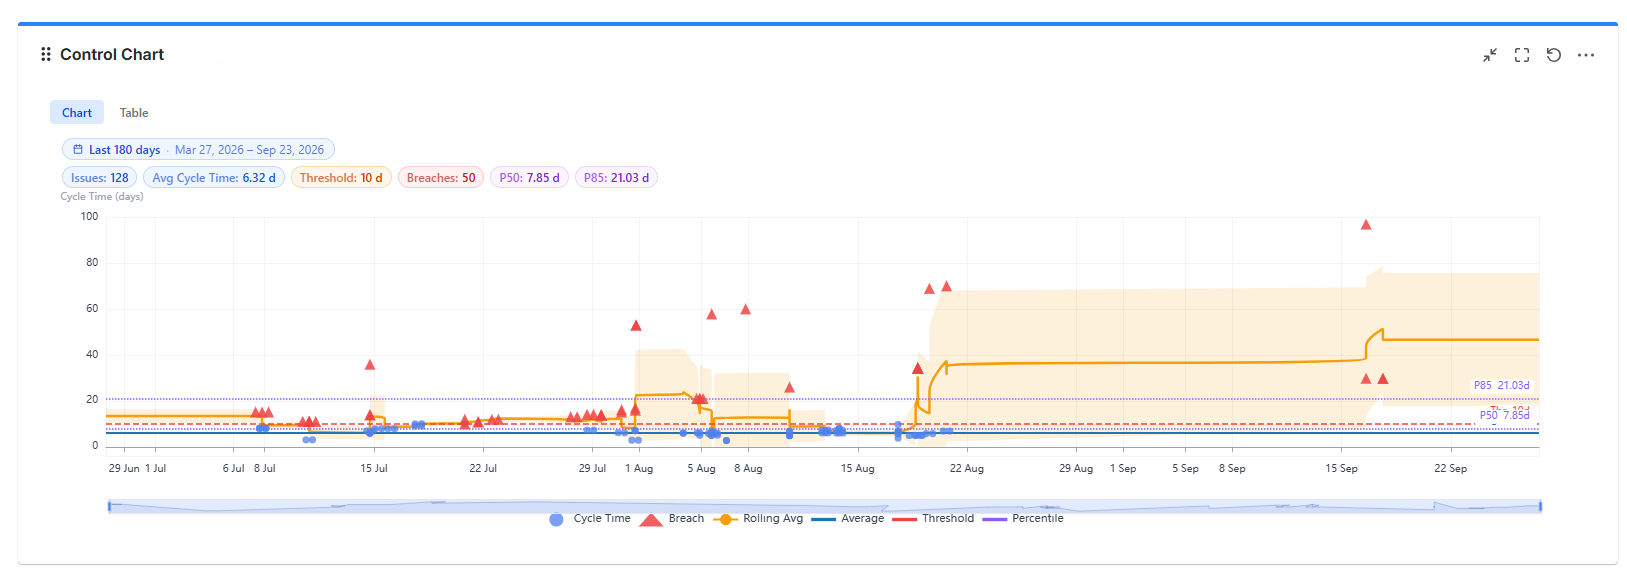
The Control Chart gadget plots the cycle time or lead time of completed work items as a scatter chart over time. Each dot is one completed item; reference lines show your average, rolling average, standard deviation band, SLA threshold, and percentiles - so you can see both how fast you deliver and how predictable that delivery is.
Use this section to define what a "cycle" means for your workflow, choose the date interval, and configure the statistical overlays.
In This Section
| Page Name | Description |
|---|---|
| Overview | What the Control Chart shows, how to read it, data sources, and date intervals. |
| Cycle Definition | Cycle time vs. lead time, start and end conditions, repeat entries, and repeated cycles. |
| Reference Lines & Scale | Average, rolling average, standard deviation band, threshold, percentiles, and log scale. |
| Display Settings & Export | Data table view, display toggles, colors, auto-refresh, and export options. |