WIP Run Chart
WIP Run Chart
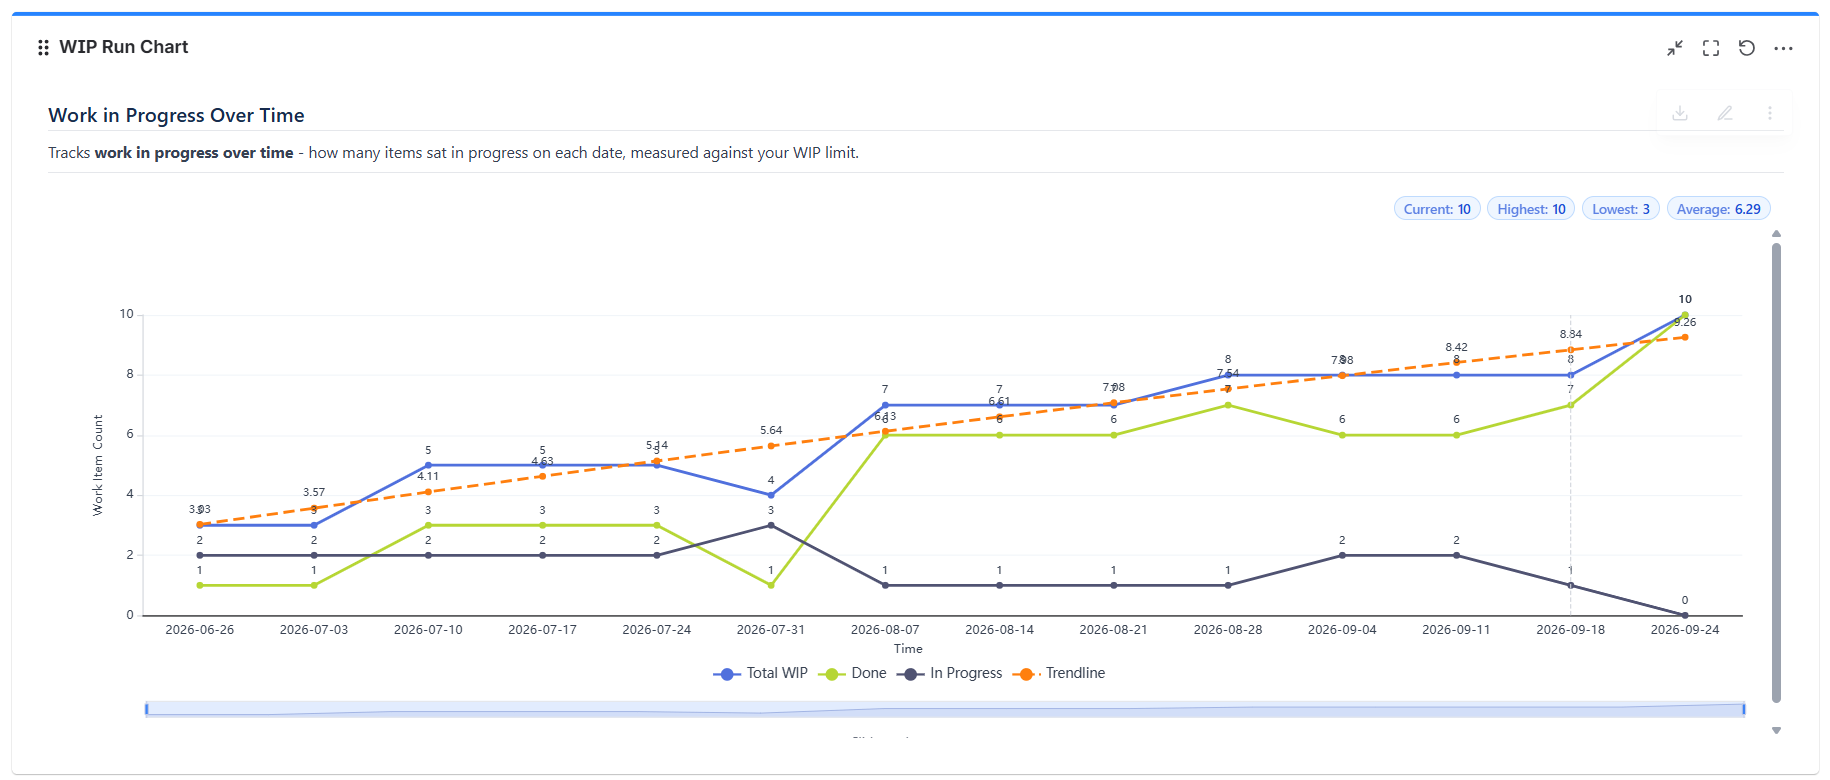
The WIP Run Chart gadget tracks how much work was in progress on every day of a period, as a line chart. Add WIP limits and the chart highlights the days you breached them.
WIP Aging tells you which items are old right now. WIP Run Chart tells you whether your team is systematically taking on too much - the root cause behind most aging work.
In This Section
| Page Name | Description |
|---|---|
| Overview | What the run chart shows, how to read it, data sources, and date ranges. |
| WIP Rule & Calculation | What counts as WIP, what gets measured, intervals, sub-tasks, and splitting. |
| Limits & Display | WIP limits and breach highlighting, trendline, display toggles, and export. |