Limits & Display
WIP Limits
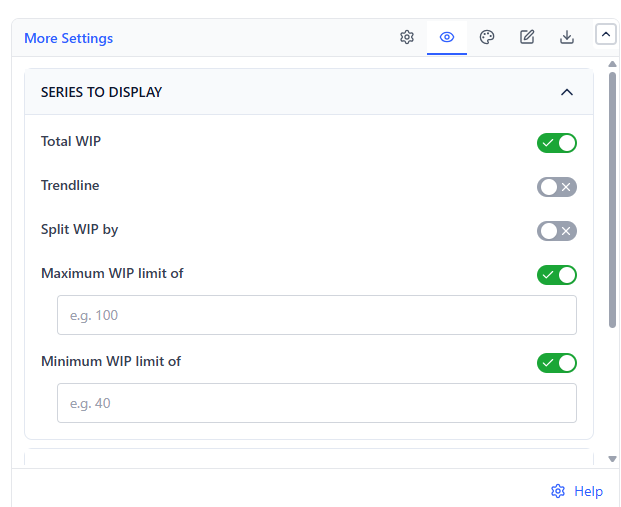
| Setting | What It Does |
|---|---|
| Max limit | Draws a ceiling line; days above it are highlighted as breaches |
| Min limit | Draws a floor line; days below it are highlighted |
Both are off by default and each is enabled independently. A common starting point for a max limit is between one and two items per team member - then tighten it until flow improves.
A limit only helps if someone reacts to a breach. Agree what happens when the line goes over - typically "stop starting, start finishing" - before you set the number.
Trendline
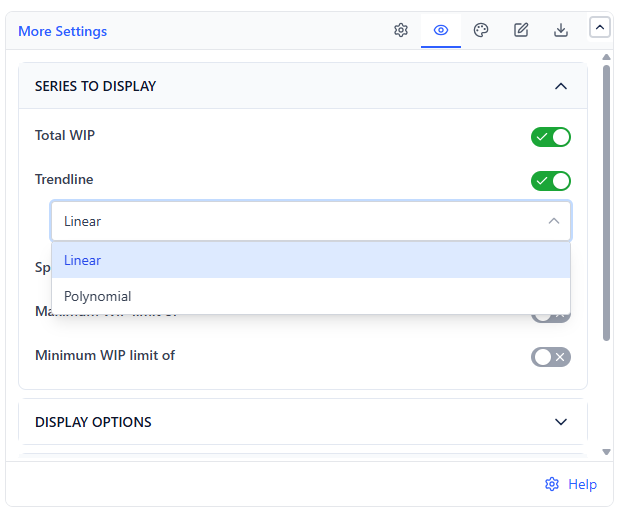
| Type | Use When |
|---|---|
| Linear (default) | You want the plain direction over the period |
| Polynomial | WIP genuinely rose and then fell and a straight line would hide it |
Display Options
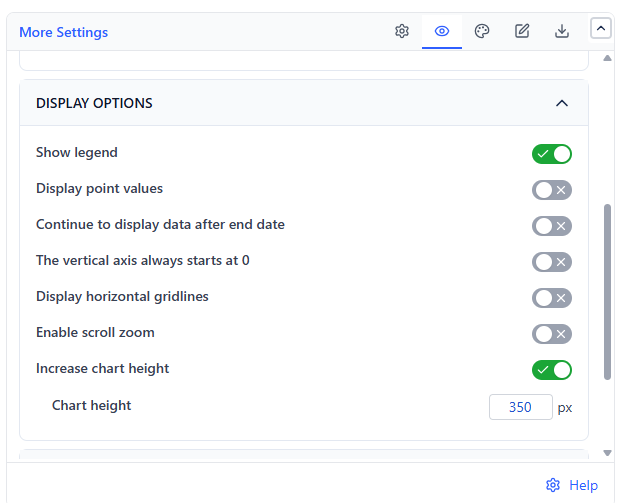 | 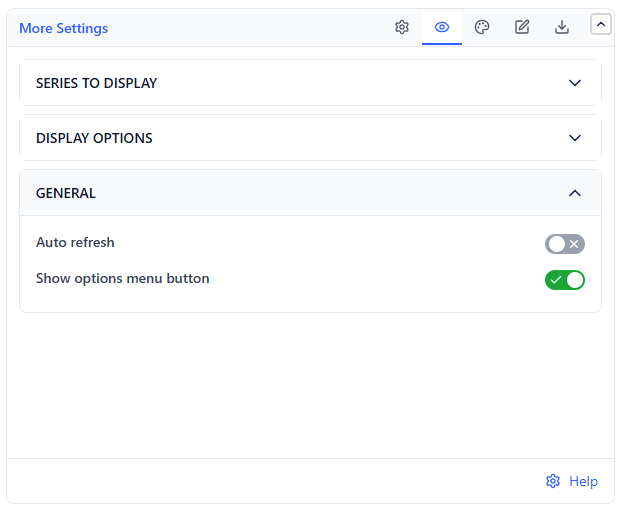 |
| Setting | What It Does | Default |
|---|---|---|
| Show total WIP | The combined line, shown alongside any split lines | On |
| Show trendline | The fitted line | On |
| Show legend | Legend for every series and limit | On |
| Show data values | Prints each point's value | Off |
| Y-axis starts at zero | Forces the Y-axis to zero rather than fitting the data | Off |
| Show gridlines | Horizontal gridlines | Off |
| Enable scroll zoom | Mouse-wheel zoom on the chart | Off |
| Continue after end date | Extends the line past the range end for still-open items | Off |
| Chart height | Explicit pixel height, or auto | Auto |
| Show options menu | The in-view refresh and export menu | On |
| Auto-refresh | 5, 10, 15, or 30 minute interval | Off (15 min) |
Colors
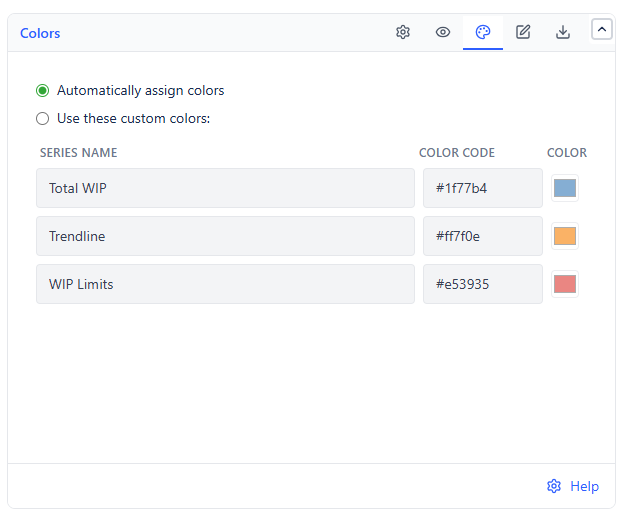
| Element | Default |
|---|---|
| Total WIP line | Blue |
| Trendline | Orange |
| WIP limit lines | Red |
Split series get palette colors automatically, and can be set individually in custom color mode.
Export
| Format | Contains |
|---|---|
| PNG | The chart as displayed, limits included |
| CSV | The per-interval numbers for Total WIP and each split series (the trendline is not included) |
Common Use Cases
Introducing WIP limits. Chart the last 90 days with no limits first to see your actual baseline, then set a max limit slightly below the average and watch whether cycle time improves.
Diagnosing a slow sprint. Overlay this on the Control Chart. If WIP climbed through the sprint, the slow cycle times were a consequence, not a mystery.
Balancing load across a team. Split by assignee and look for one line consistently above the others - that is the person to unload, not the person to push.