WIP Run Chart
Overview
The X-axis is time; the Y-axis is how much work was in progress at each point. One line shows total WIP, and you can optionally split it into one line per field value.
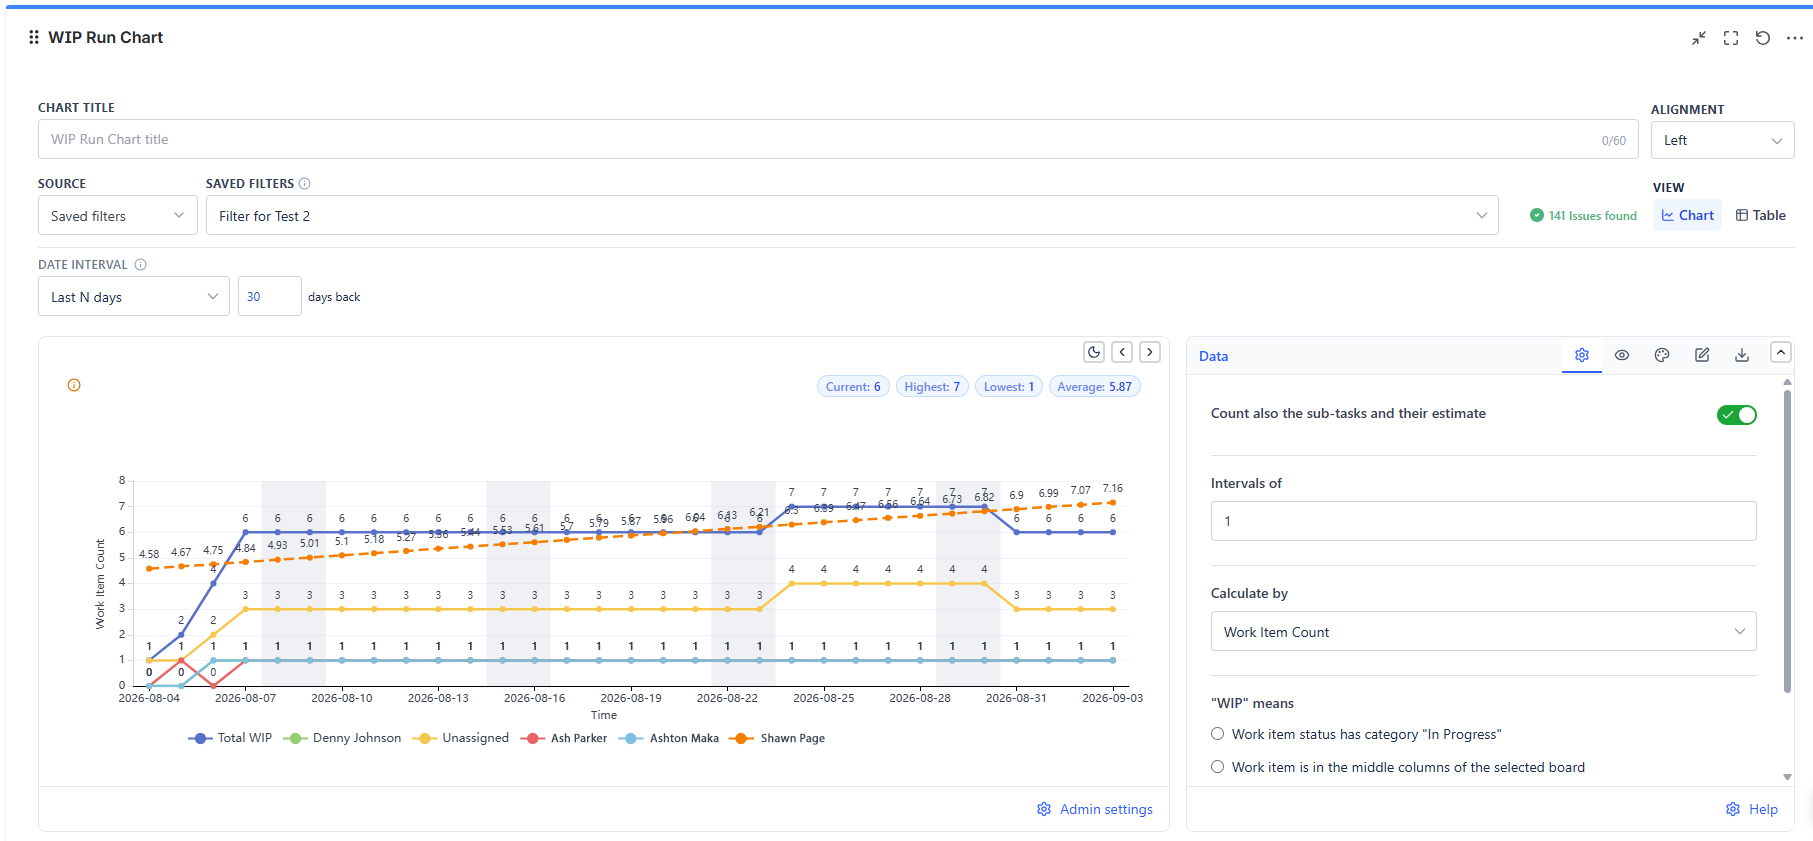
Overview
| Feature | Description |
|---|---|
| WIP Over Time | A line showing in-progress volume across the period |
| Three WIP Rules | Status category, board middle columns, or an explicit status list |
| Five Measures | Work item count, story points, story point estimate, original estimate hours, or any numeric custom field |
| WIP Limits | Optional max and min limits, with breach highlighting |
| Trendline | Linear or polynomial fit |
| Split by Field | One line per value of a field - per assignee, per issue type, per priority |
| Data Table View | The underlying per-interval numbers, exportable |
How to Read the Chart
- A rising line = you are starting work faster than you are finishing it. Cycle time will follow it upward
- A flat line = start rate and finish rate are balanced. This is what a healthy team looks like
- A sawtooth pattern = work is batched, usually to sprint boundaries; everything starts on day one and lands at the end
- A line above your max limit = too many things open at once; expect context-switching and slow delivery
- A line below your min limit = the team may be starved of ready work
Action pattern: Fix WIP before fixing cycle time. Cycle time is a symptom; WIP is usually the cause.
Data Sources
Projects, Board, Saved Filter, Custom JQL, and Dynamic Filter Controller.
Date Range
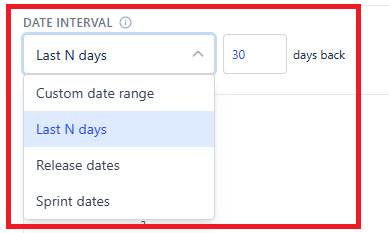
| Mode | What It Covers |
|---|---|
| Last N days (default, 30) | A rolling window that moves forward on its own |
| Custom date range | A fixed start and end date |
| Sprint dates | A specific sprint's dates, or auto-follow the latest or previous sprint |
| Release dates | A release's start and release dates |
Continue after end date extends the line past the end of the range when items are still open - useful for showing that a sprint's leftovers did not disappear at the sprint boundary.