Histogram Chart
Overview
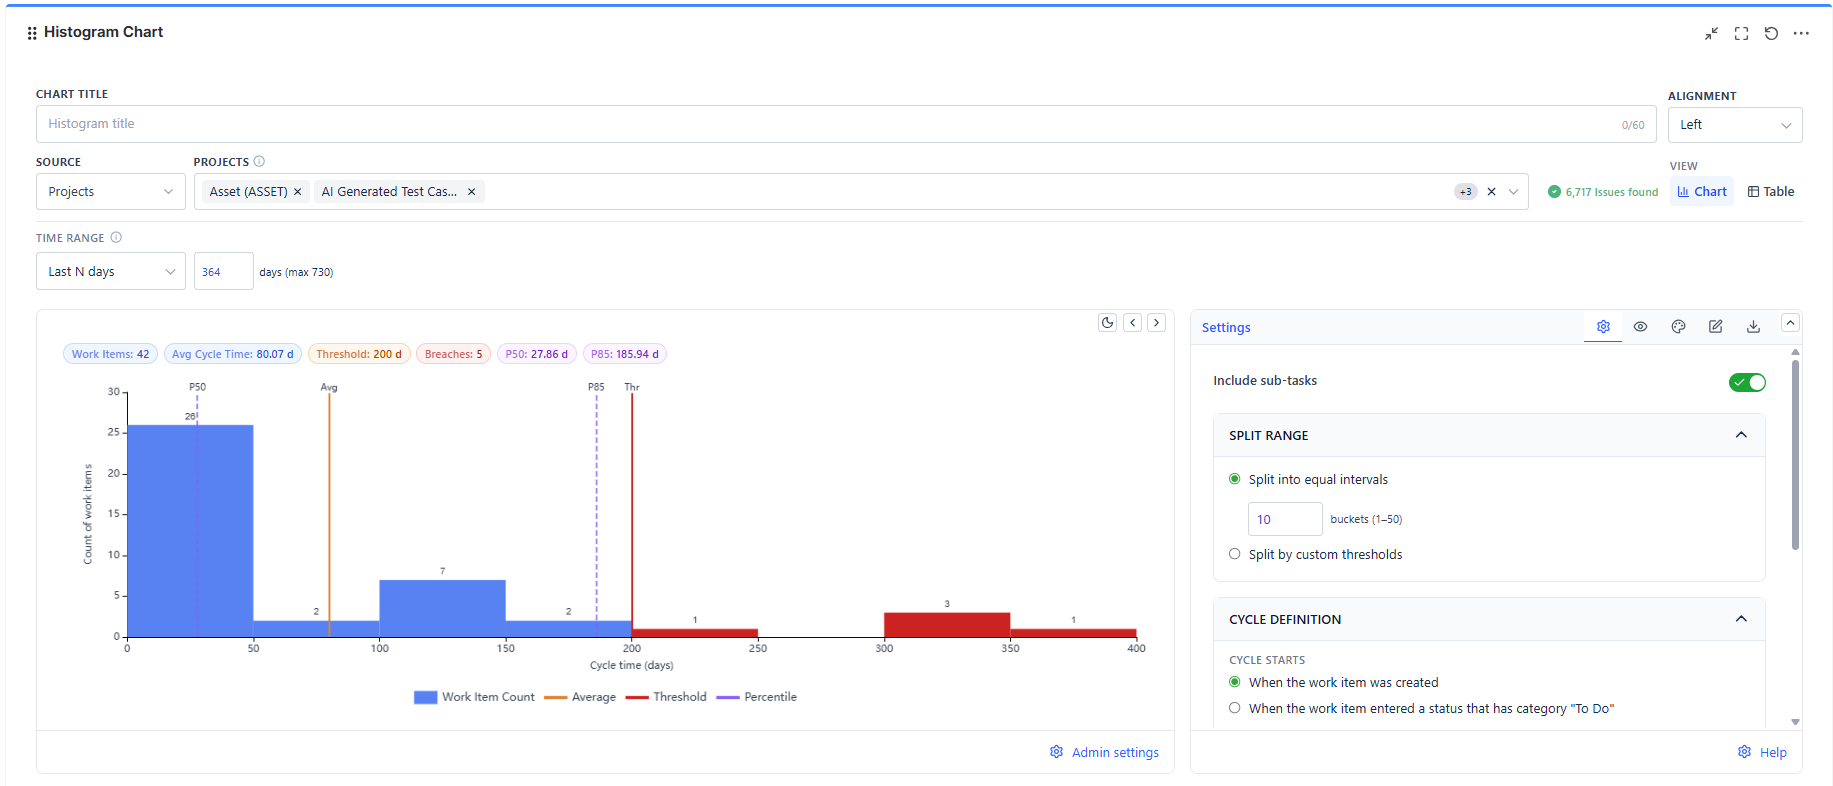
Each bar counts the work items whose cycle fell inside that duration bucket. The X-axis is duration; the Y-axis is the number of items. The cycle definition, calculation settings, and date intervals work much as they do in the Control Chart - the difference is entirely in how the result is presented.
Overview
| Feature | Description |
|---|---|
| Frequency Distribution | One bar per duration bucket, height = number of work items |
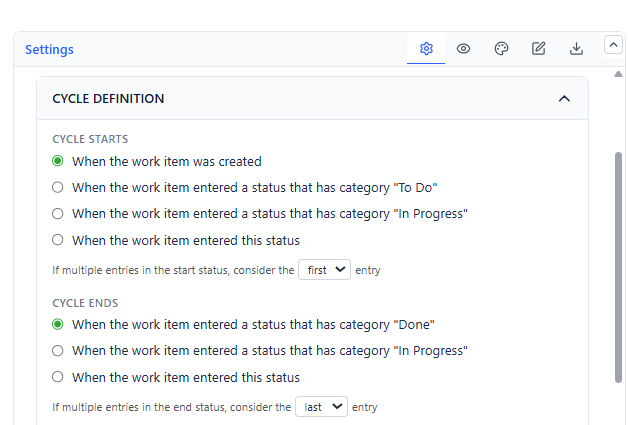
| Cycle or Lead Time | For lead time, choose When the work item was created under Cycle starts; otherwise set your own start and end conditions |
| Two Bucketing Modes | Equal-width intervals, or your own comma-separated thresholds |
| Reference Lines | Average, threshold, and percentile lines |
| Data Table View | The items behind every bucket, exportable |
| Data Zoom | Scroll and zoom the X-axis when the range is wide |
How to Read the Distribution
- A tall bar near the left with a short tail = healthy, predictable flow
- A long flat tail to the right = a minority of items take far longer; these drive stakeholder perception
- Two separate peaks = you are really measuring two different kinds of work. Split the data source by issue type and chart them separately
- A bar sitting at the far right on its own = stalled or abandoned items; check whether they ever truly completed
Action pattern: Do not try to move the average. Try to cut the tail. Shortening the slow 15% improves predictability far more than shaving a day off the typical case.
Data Sources
Projects, Board, Saved Filter, Custom JQL, and Dynamic Filter Controller - the same five sources as the Control Chart.
Date Interval
| Interval Type | What It Covers |
|---|---|
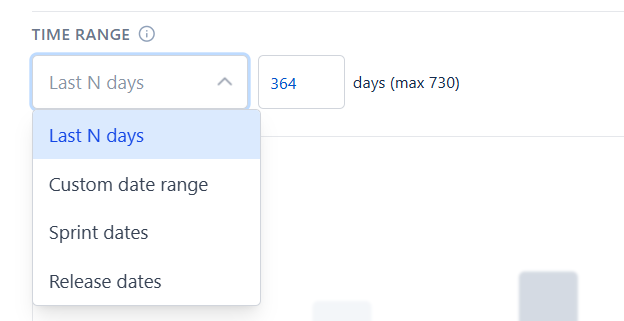
| Last N days (default, 364) | A rolling window. The wide default gives the distribution enough items to have a shape |
| Custom date range | A fixed start and end date |
| Sprint dates | Any board and sprint supplies the window; auto-latest follows the active sprint |
| Release dates | Any project and release supplies the window |
A histogram needs volume. With fewer than about 30 completed items the shape is noise - widen the window before drawing conclusions.