Histogram Chart
Buckets & Split Range
How you cut the range decides what the chart says. Too few buckets hides the tail; too many turns the distribution into a comb of single-item bars.
Split Modes
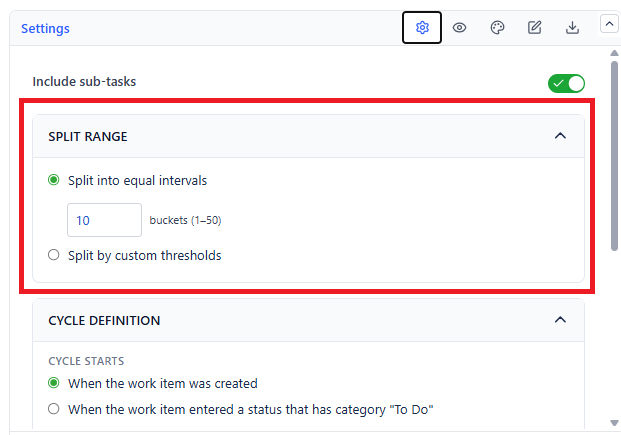
| Mode | How Buckets Are Built | Best For |
|---|---|---|
| Split into equal intervals (default) | Divides 0 to the largest cycle time into N equal-width buckets. Default N = 10 | A first look, when you do not yet know the range |
| Split by custom thresholds | You enter the boundaries, comma-separated (for example 100, 200, 300, 400, 500) | Reporting against SLA tiers or planning brackets |
Choosing Equal Intervals
| Bucket Count | Result |
|---|---|
| 5-8 | Broad shape, easy to read in a small dashboard tile |
| 10 (default) | Balanced - enough resolution to see a tail |
| 15-20 | Fine detail; needs a wide gadget and a decent item count |
One long-running outlier stretches the whole range, because the last bucket is anchored to the largest cycle time. If nine of ten buckets come back empty, either switch to custom thresholds or narrow the data source.
Choosing Custom Thresholds
Custom thresholds are the right choice when the buckets need to mean something to the reader. Match them to the language your team already uses:
- SLA tiers:
1, 3, 5, 10- same day, a few days, a week, over a week - Sprint arithmetic:
5, 10, 15, 20- within a sprint, one sprint over, and so on - Escalation brackets:
7, 14, 30- fine, watch, escalate
Enter boundaries in ascending order, separated by commas. Everything above your last threshold falls into a final open-ended bucket.
Calculation Settings
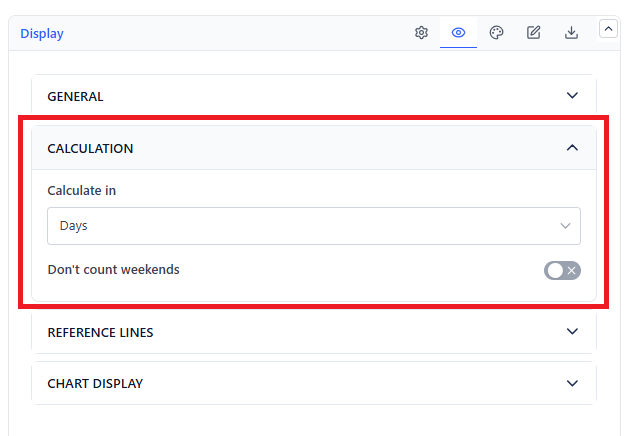 | 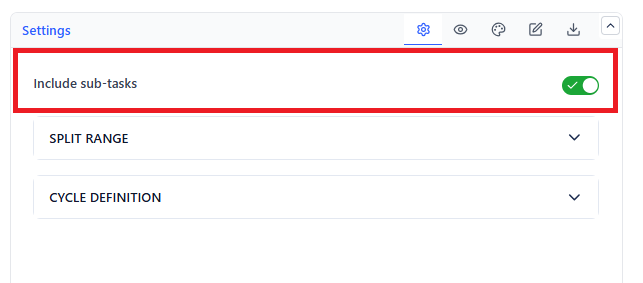 |
The same options as the Control Chart apply, and they change the numbers before bucketing happens:
| Setting | Effect | Default |
|---|---|---|
| Calculate in | Days, Hours, or Minutes - also the unit of your thresholds | Days |
| Don't count weekends | Durations reflect working time | Off |
| Include sub-tasks | Counts sub-tasks as their own items | Off |
| For the work items that have multiple cycles (Cycle Definition) | Default here is all cycles, so rework is visible in the distribution | Display all cycles |