Histogram Chart
Histogram Chart
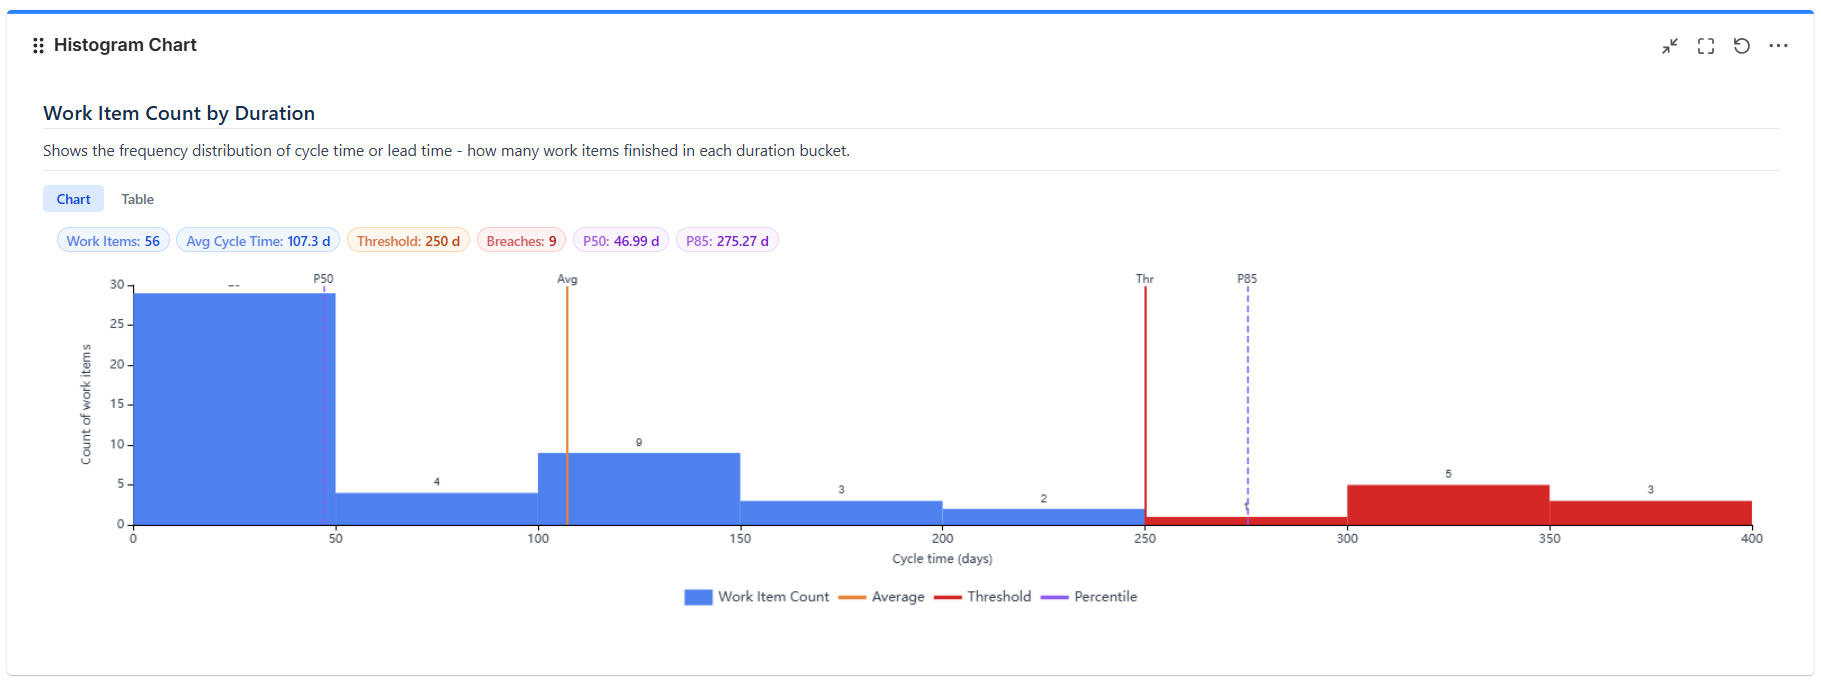
The Histogram Chart gadget shows the frequency distribution of cycle time or lead time - how many work items finished in each duration bucket. Where the Control Chart shows delivery over time, the histogram shows the shape of your delivery: whether most items cluster tightly, or whether you have a long slow tail.
In This Section
| Page Name | Description |
|---|---|
| Overview | What the histogram shows, how to read the distribution, data sources, and intervals. |
| Buckets & Split Range | Equal intervals vs. custom thresholds, and how to choose bucket boundaries. |
| Reference Lines & Display | Average, threshold, percentiles, display toggles, colors, and export. |