Issue Filter Formula
Overview
The gadget works in three layers. Understand the layers and the rest of the configuration is straightforward.
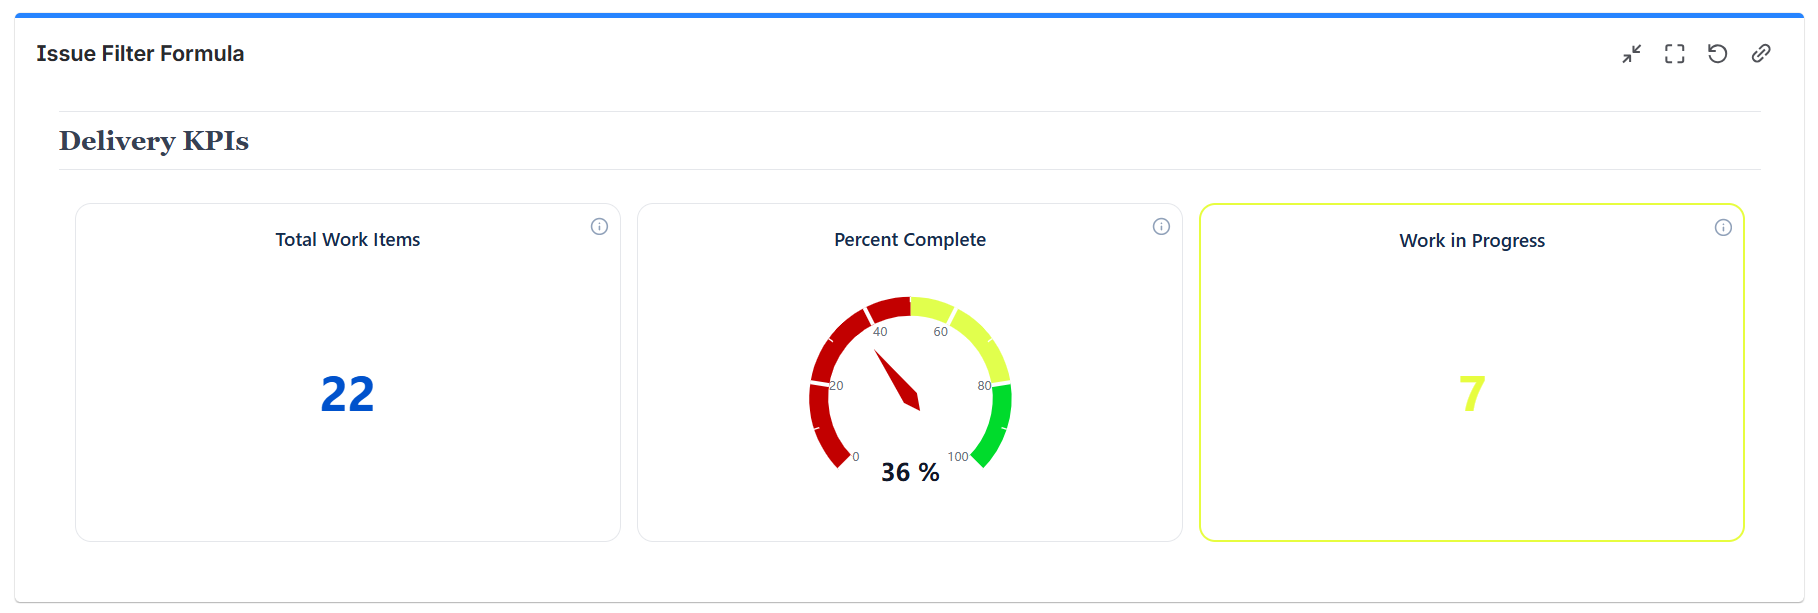
| Layer | What It Is | How Many |
|---|---|---|
| Variables | Named aggregations over Jira issues, called a through i. Each has its own data source and JQL | Up to 9 |
| Formulas | Math expressions over those variables | As many as you need |
| Displays | How each formula's result is rendered | One mode per formula |
A Worked Example
To show escaped defect rate - bugs found in production as a percentage of all bugs:
- Variable
a: Count of work items, JQLtype = Bug AND labels = production - Variable
b: Count of work items, JQLtype = Bug - Formula:
a / b * 100, suffix%, 1 decimal - Display: gauge, 0 to 100, green under 5, amber to 15, red above
The result is a single number your leadership can read, computed from two completely independent queries.
Why Separate Data Sources Matter
Each variable resolves its own scope. That means one formula can compare different projects, different time windows, or different issue types - something no single-query gadget can do.
| Comparison | How |
|---|---|
| This sprint vs. last sprint | Two variables, two sprint-scoped JQL queries |
| Team A vs. Team B | Two variables, two project or component scopes |
| Bugs vs. stories | Two variables, two issue-type filters |
| Actual vs. target | One variable plus a constant in the formula |
Overview
| Feature | Description |
|---|---|
| 9 Variables | Named a to i, each independently scoped |
| 5 Aggregations | Count, Sum, Average, Minimum, Maximum |
| Full Function Library | Arithmetic plus rounding, logs, conditionals, and aggregate functions |
| 4 Display Modes | Number, number colored by value, gauge chart, and star rating |
| Color Rules | Value ranges that drive the color of the result |
| Card Layout | Multiple formulas laid out as cards in one gadget |
Data Sources
Every variable supports Projects, Board, Saved Filter, Custom JQL, and Dynamic Filter Controller - chosen per variable, not once for the gadget.