Time Frame
The time frame decides how many bars you get and how wide each one is. It is the difference between a chart that shows a trend and a chart that shows noise.
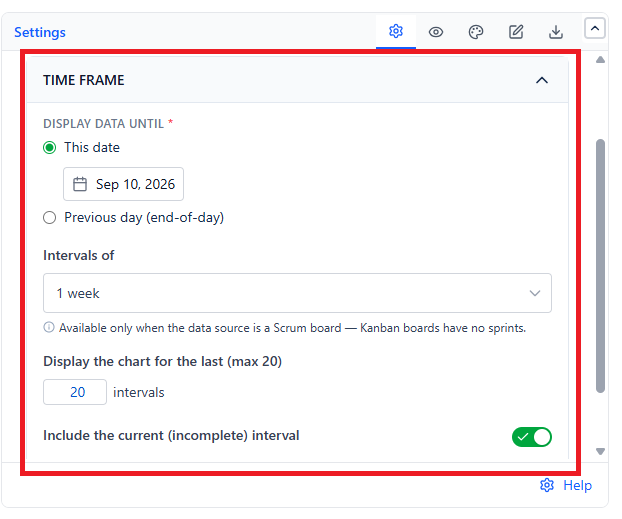
Display Data Until
| Option | Behavior |
|---|---|
| This date | Anchors the chart to a fixed date. That date is the start of the final interval, so the last bar runs one full interval past it |
| Previous day (end-of-day) (default) | Anchors to yesterday, so the chart rolls forward on its own with nobody editing the gadget |
Use a fixed date when the chart backs a specific report or review. Use previous day for any dashboard that stays up.
Interval Length
| Option | Bars Cover | Good For |
|---|---|---|
| 1 week (default) | Seven days each | Fast feedback, high-volume teams |
| 2 / 3 / 4 weeks | Multi-week buckets | Matching your sprint cadence without using sprint dates |
| 6 / 8 weeks | Long buckets | Low-volume teams, or a full-year view |
| 1 calendar month | Calendar months, labelled MMM YY | Reporting that has to line up with monthly business cycles |
| Board Sprints | Each sprint's own real dates, labelled with the sprint name | Retrospectives - bars match what the team actually lived |
Board Sprints handles uneven sprint lengths correctly, because each bar uses that sprint's own start and end dates rather than a fixed width.
Interval Count
Display the chart for the last (max 20) sets the total number of bars, between 1 and 20 (default 3) - this is the total drawn, not a count added on top of the current interval. Past roughly 20 bars the X-axis labels stop being readable, which is why 20 is the cap.
| Count | With 1-week intervals | With 1-month intervals |
|---|---|---|
| 6 | Six weeks - a quarter's worth of recent signal | Half a year |
| 12 | A quarter | A full year |
| 20 | Roughly five months | Not recommended - labels crowd |
Include the Current Interval
Off by default. The current interval is incomplete - only the items that happen to have finished so far are counted - so its bar is usually misleadingly low or high. Turn it on only when you want a live in-progress read and the audience understands the last bar is partial.