Display Settings & Export
Series Toggles
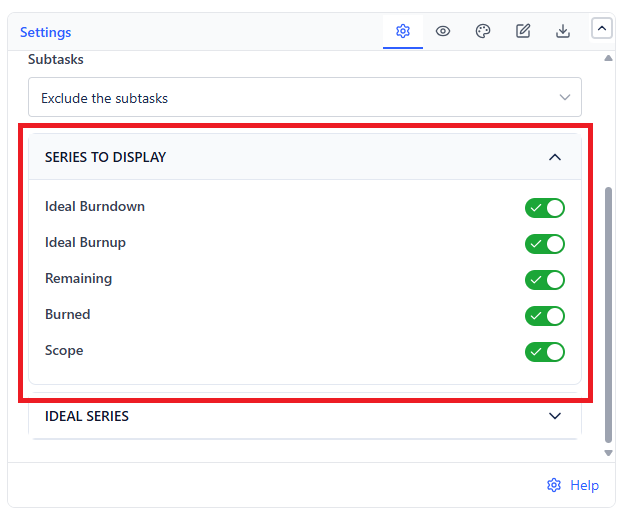
Each of the five series can be shown or hidden: Ideal Burndown, Ideal Burnup, Remaining, Burned, and Scope. All are on by default. With Remaining Time Estimate, only Ideal Burndown and Remaining are available.
| Combination | Reads As |
|---|---|
| Remaining + Ideal Burndown | The classic burndown. Cleanest for a daily standup |
| Burned + Ideal Burnup | A burnup view. Better for stakeholders who prefer progress rising |
| Remaining + Scope | Diagnoses scope creep. The best pairing for a retrospective |
| All five | Complete but busy - use only on a wide gadget |
Display Options
 |  |
| Setting | What It Does | Default |
|---|---|---|
| Show legend | Legend for the visible series | On |
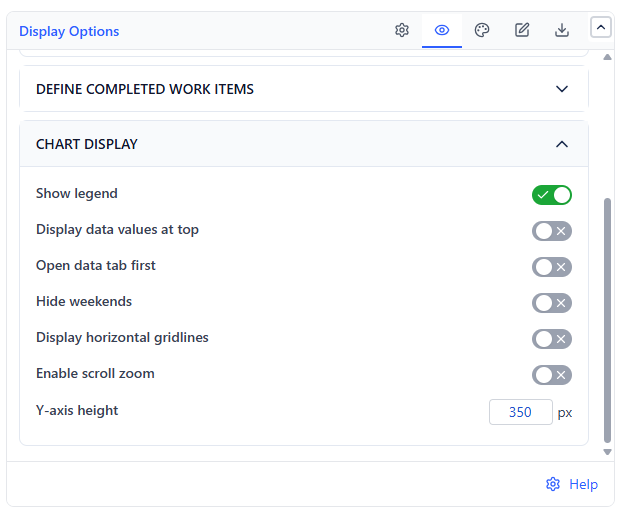
| Display data values at top | Prints each point's value | Off |
| Hide weekends | Removes weekend days from the X-axis | Off |
| Display horizontal gridlines | Horizontal gridlines | Off |
| Enable scroll zoom | Mouse-wheel zoom | Off |
| Increase chart height | Sets the chart to a fixed Y-axis height in pixels (320-600) | Off |
| Open data tab first | View mode opens on the table | Off |
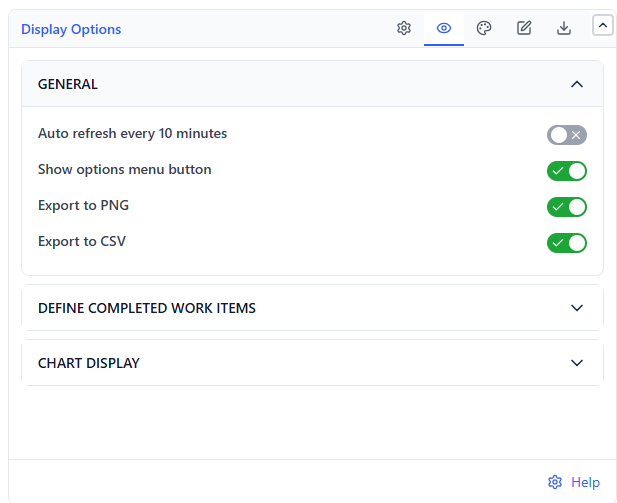
| Show options menu button | The in-view refresh and export menu | On |
| Auto refresh every 10 minutes | Re-fetches sprint data every 10 minutes in view mode | Off |
| Export to PNG / Export to CSV | Offer each export in the options menu | On |
Colors
| Series | Default |
|---|---|
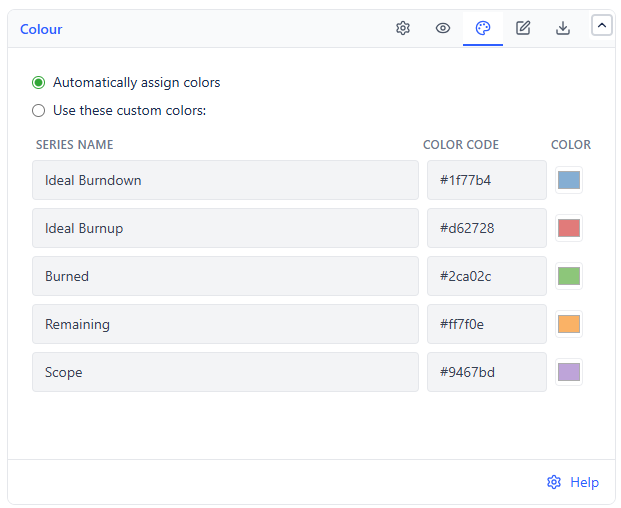
| Ideal Burndown | Blue |
| Ideal Burnup | Red |
| Burned | Green |
| Remaining | Orange |
| Scope | Purple |
Select Use these custom colors to set each series individually - useful when your organization has a house palette for status reporting.
Data Table View
The table lists every work item in the sprint: key, summary, type, assignee, status, a completion note, and its estimate, with a total. Use it when someone questions a number, and to copy figures into a sprint report.
Export
| Format | Contains |
|---|---|
| PNG | The chart as displayed, named after the sprint (Chart view only) |
| CSV | One row per work item: key, summary, type, assignee, status, completion note, and the measure value |
Both exports can be disabled independently if you want the chart visible but not extractable.
Common Use Cases
Daily standup. Remaining plus Ideal Burndown, auto-latest sprint, auto-refresh on. It stays correct across sprints with no editing.
Sprint review. Turn on the Scope series. If scope stepped up mid-sprint, lead with that.
Retrospective. Open the data table and look at the work items marked as not completed - they usually point to the blocker.
Executive rollup. Use Burned plus Ideal Burnup - a rising line reads as progress to an audience that does not live in Jira.